top of page


News
leitart - data in action
Unlock the full potential with one comprehensive license. Small investment, big impact: Transform your analytics into a complete business application platform in just minutes.

Planning Wind Farms for the Next 30 Years – with Qlik data+
Wie plant man eine Investition, die über Jahrzehnte läuft, ohne dabei jedes Jahr von Hand neu einzutragen? Genau diese Frage hat unser Team kürzlich in einem Kundenprojekt beantwortet: Ein Windpark sollte für die nächsten 30 Jahre geplant werden – und zwar mit möglichst wenig manuellem Aufwand. Im neuesten Video zeigen wir, wie das mit Qlik und data+ funktioniert.
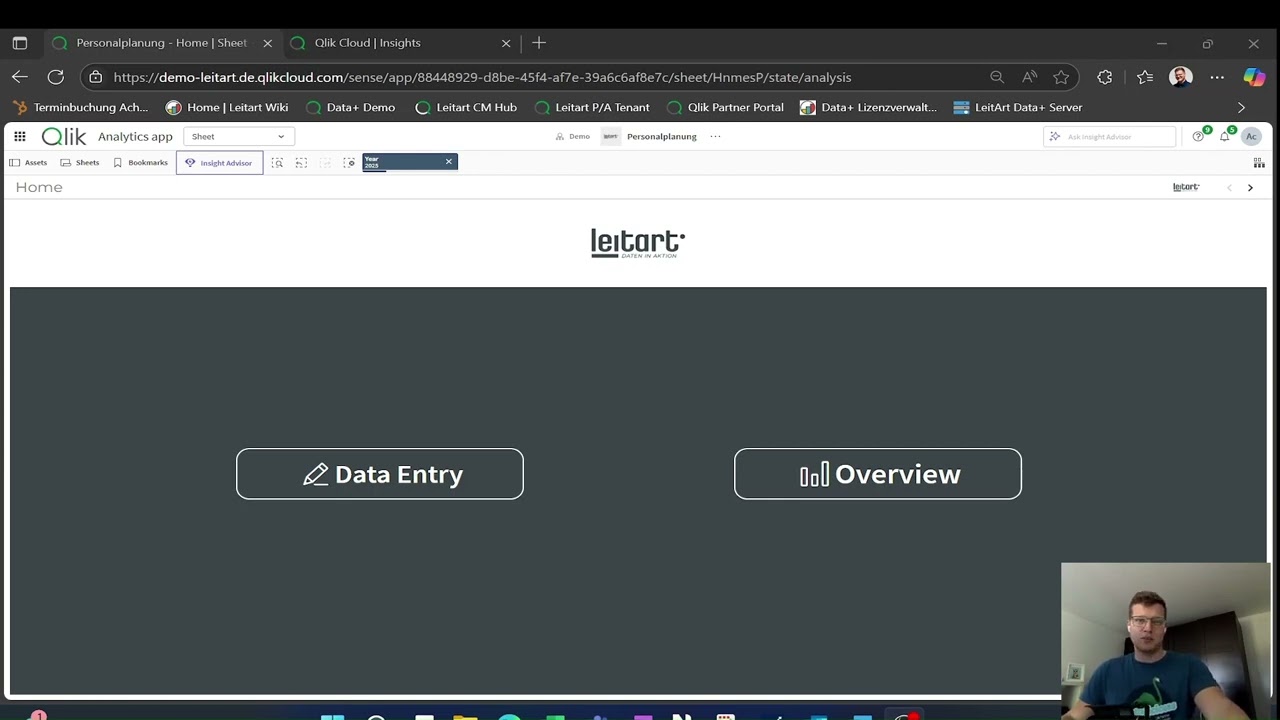
FTE and Project Planning Directly in Qlik – Why It’s Worth a Closer Look
“Does it make sense to plan FTEs and projects directly in a BI tool like Qlik?”
A few years ago, the answer would probably have been: No. Today, we are convinced: there is little reason left to invest in separate planning software.

What We Love About Qlik? Real-Time Interactivity – Powered by dataplus
In our latest YouTube video, we decided to flip the script. Instead of talking about what frustrates us as Qlik developers (looking at you, QMC and Excel exports), we asked ourselves: What do we actually love about Qlik?Die Antwort: Die Interaktivität in Echtzeit.

More Context, Better Collaboration: Comment History in data+
The latest update in the data+ Suite brings a small but powerful improvement to your Qlik apps: Comment History.
If you've used standard text inputs in data+ before, you'll appreciate this
Wer bereits mit der klassischen Texteingabe in data+ gearbeitet hat, wird die Weiterentwicklung lieben: Statt flacher Einträge, die mit jedem Speichern überschrieben werden, bietet die Comment History eine dialogartige Oberfläche mit klarer Zuordnung von Autor und Zeitstempel – ganz wie in

data+ Tutorial: Custom Colors in Qlik with the Color Picker
Make your dashboards more intuitive – with personalized color coding directly inside Qlik. In this data+ tutorial, we show you how to use the Color Picker input to enhance readability and user experience without any extra development effort.


Boolean Input in Qlik: Using Checkboxes with dataplus
Working with input fields in Qlik Sense is essential for planning and controlling apps. With the data+ Suite by leitart, it becomes not only possible – but intuitive. In this article, we show how to use checkboxes as a Boolean input in a data+ Table – using a discount flag for sales positions as an example.


Dynamic Column Switching in a data+ Table
Data visualization should be flexible and interactive to make analysis more efficient. In this post, we will show you how to dynamically switch columns in a data+ Table with just one click of a button. Why Dynamic Column Switching? When working with large datasets, a table can quickly become cluttered and confusing. One solution is to show only relevant columns and switch between different views with a simple action. This offers the following benefits: Better clarity Inte

Enhance Qlik Dashboards with Interactive data+ Text Fields in Seconds
In today's data-driven landscape, the ability to interact directly with data is crucial for effective analysis and decision-making. Recognizing this need, leitart has developed the data+ Text Field Creation Extension for Qlik Sense, enabling users to seamlessly add comment fields to their dashboards, thereby enhancing interactivity and user engagement. Enhancing Dashboards with Comment Fields Traditionally, incorporating comment fields into Qlik Sense tables required manual c

Effortless Data Customization: Master Qlik with the dataplus Rule Editor
In the realm of data analytics, the ability to customize and control data presentation is paramount. leitart's dataplus Rule Editor emerges as a powerful tool, enabling users to tailor their data tables in Qlik Sense with precision and ease. Empowering Users with Customization The dataplus Rule Editor offers a user-friendly interface that allows both technical and non-technical users to define specific rules for data visualization. This functionality ensures that data is pr

Qlik AutoML and data+: Predicting Netflix Movie Ratings?
In the realm of data-driven decision-making, the integration of machine learning into business intelligence platforms has opened new avenues for predictive analytics. A compelling example of this is the use of Qlik AutoML and data+ to forecast IMDb ratings for Netflix movies, enabling users to harness advanced analytics without extensive programming expertise. Seamless Integration of Qlik AutoML and data+ Qlik AutoML empowers users to develop and deploy machine learning mode
bottom of page