top of page
Sustainability Reporting with Qlik & Data+

Sustainability Reporting with Qlik & Data+

Climate goals and ESG regulations require companies to regularly track and report sustainability metrics. With Qlik Sense and the Data+ Suite, ESG reporting becomes transparent, automated, and actionable – no Excel needed.

Supply Chain Monitoring

Use Case I
Fragmented ESG Data and Manual Effort

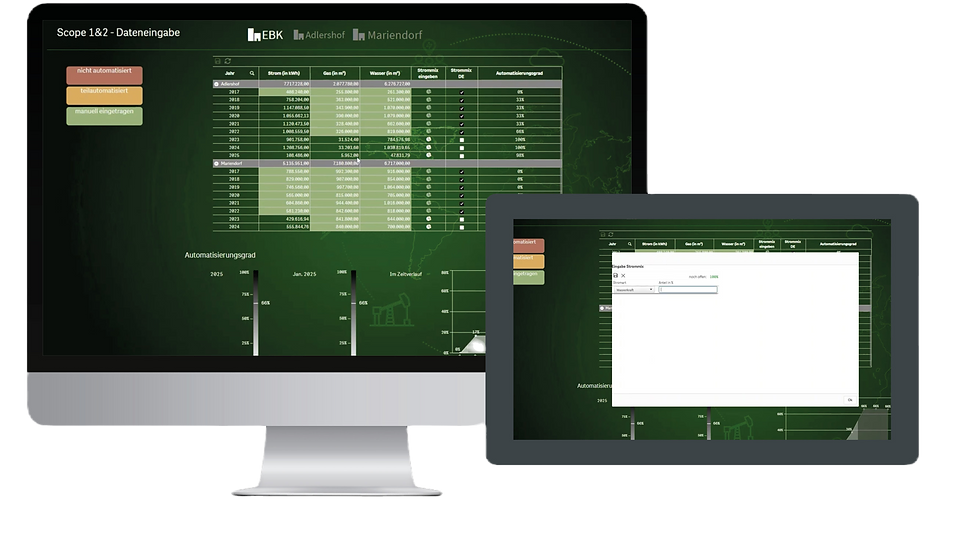
ESG QlikApp - No longer fragmented ESG Data and manual Effort

THE CHALLENGE

66%

of ESG data was automated

0%

automated data flow

Many sustainability figures – such as energy usage and CO₂ emissions – are still collected manually. This leads to time-consuming processes and incomplete reports

ESG App in Qlik
Icon leitart

ESG App with Writeback in Qlik

Fragmented ESG Data and Manual Effort

Manual input now embedded directly in the dashboard

Icon leitart

THE SOLUTION

1 view

of all relevant information

100%

automation achieved

Using Qlik Sense and the Data+ Suite, an interactive ESG app was developed. It merges sensor data and API feeds with manual input directly in Qlik – including electricity mix selection, emission forecasts, and target comparisons.

More Transparency, Less CO₂, Better Decisions

Qlik Dataplus - ESG electricity mix sustainability

THE 
RESULTS

12 %

Carbon footprint reduced in the first year

300

kWh on-site solar energy generated

With real-time data, custom input, and clear visuals, actionable sustainability measures were implemented – including a switch to 100% water power.

GET IN TOUCH

Contact person

Whether standardized processes or individual challenges - our dedicated team is at your side with the know-how to quickly adapt to new situations and deploy your resources correctly.

Achim Gnadt

Phone     +49 170 5442045‬

Email       achim.gnadt@leitart.de

bottom of page